
LiveMapping – a work in progress (beta)
The problem with maps in an urban context is that they tend to simplify and fix a city that is complex and always changing.
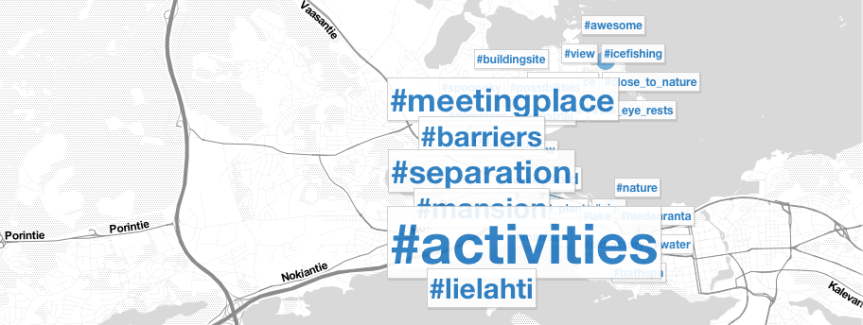
The screenshots of maps is taken from a workshop, Mapping Urbanity, with students of urban design in Tampere, Finland, February 2016. Link to map
Henri Lefebvre is maybe the most outspoken critic of the use of maps to represent cities:
As with every dynamic organization, cities are fluid and mobile and any attempt to stop them in order to analyze and represent them risks killing them.
Bruno Latour – with Albena Yaneva – points to a similar problem when it comes to architectural drawings in his text “Give me a gun and I will make all buildings move…” The drawings a simply too finished and doesn’t show the complex process that leads to the construction of a building and the way it is used and changed after it is “finished”
That is, we should finally be able to picture a building as a moving modulator regulating different intensities of engagement, redirecting users’ attention, mixing and putting people together, concentrating flows of actors and distributing them so as to compose a productive force in time-space.

Main purpose with LiveMapping is to produce maps that are both dynamic and hybrid in order to reflect the complexity and movements of the city.
Hybrid maps – Combining the spatial (geographical) qualitative (stories/interviews) and quantitative (word clouds)
Dynamic maps – Open and explorative – Letting patterns emerge and show change over time
Technically, Live mapping is using the standard Twitter app on smartphones:
The mapping is done by sending geotagged tweets onsite with #keywords and media – photo, audio, video

Main elements:
Curated and crowdsourced – No special app required – just a special #hashtag – makes crowdsourcing local knowledge very easy. We do however believe that the mapping should be curated as a start to create a “critical mass” that is true to the complexity of a location
Overview and complexity – Get the big picture by zooming out (word cloud) and the complexity by zooming in (individual stories/tweets)
Social media – Link to twitter (and facebook/instagram) where the conversation can continue and show on the map
Urban media – Documentation of local stories as a new hyperlocal media – onsite links such as QR codes and location aware notifications
Common ground and goals – Maps gradually show patterns that can form a dialogue about local commonalities – where and what is important
Managing and evaluating projects – Based on common goals a set of qualitative and quantitative indicators can structure the mapping
Documenting change – initial mapping can form a local baseline and subsequent mappings can show where change has happened
More on how to use the map here
Below a time plan that shows how mappings can be integrated into a 3 year process.
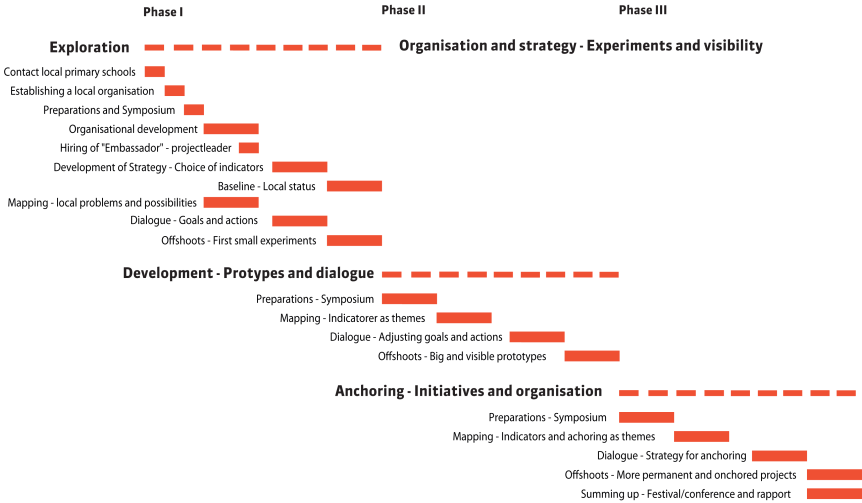
Same time plan but in a better resolution – Timeplan_UEL
LiveMapping is a collaboration with MapCentia

3 thoughts on “LiveMapping”