
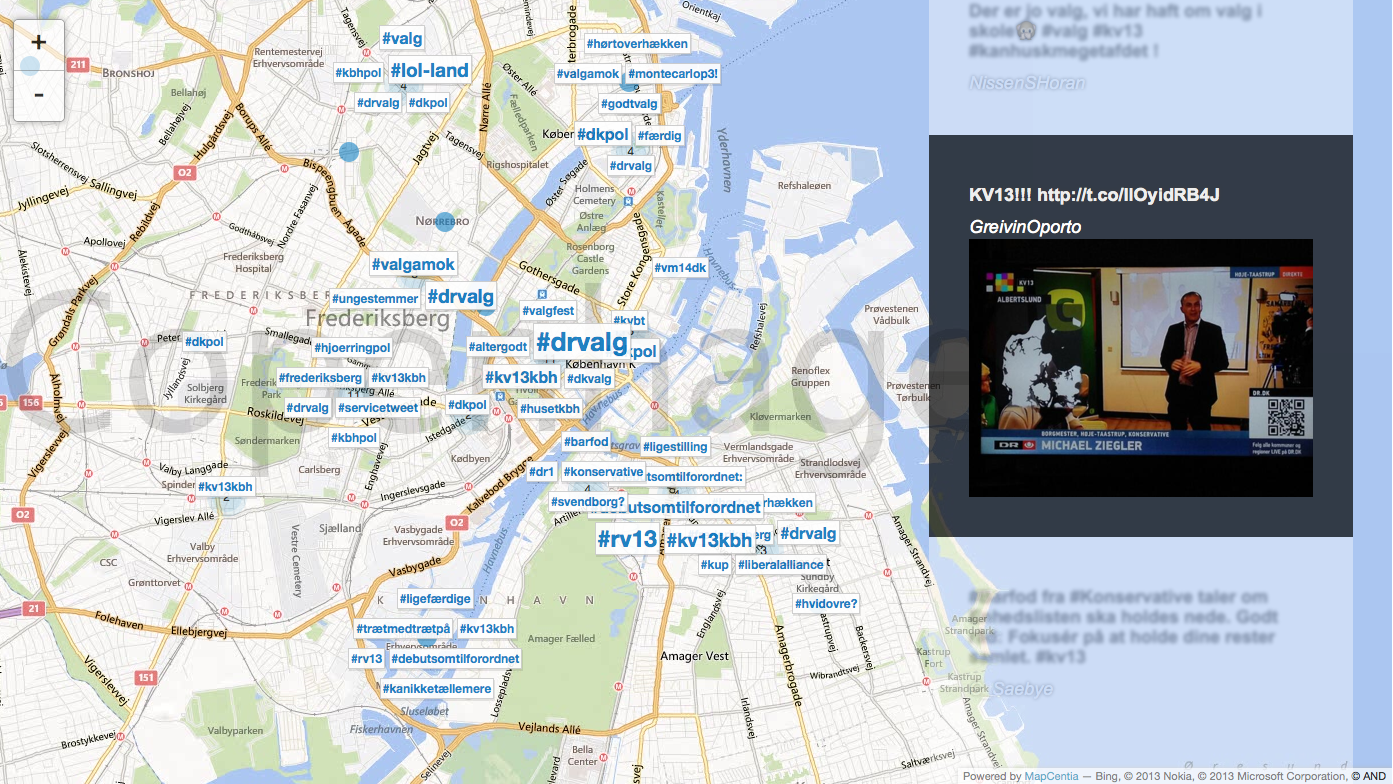
Our collaboration with Mapcentia is showing results. Take a look on a live map of tweets from Manhatten NYC here. And a map (above) showing the results from the recent local elections in Denmark with twitter feed here.
We are currently having some problems with the maps – we are working on some new and even better maps. In the meantime you can have a look here. It is a map that students of Landscape and Urban design did as their first analysis of Hedehusene.
The links show how the very basic part of the mapping tool “harvest” geotagged tweets and show their #hashtags in different sizes according to how often the same #hashtag occurs.
The link that shows the live situation on Manhattan is “crowdsourced”. The CiTyBee mapping tool is more thought to be “curated” where it shows the stories that have been collected “on the ground” (the 1 : 1 mapping) Based on the “curated” map the crowdsoured map can take off and create an urban dialogue.
See more on our thoughts about mapping here.
